本节内容:
highcharts line直线图。
之前介绍过,Highcharts 饼状图(内存使用监视)的例子,大家可以参考下。
>>> 如果你不知HighCharts为何物,请参阅本站 Highcharts教程 中的相关内容。
具体实现方法,如下:
1、引入highCharts的js
复制代码 代码示例:
<script type="text/
javascript" src="${resource(dir: 'js', file: '
jquery-1.6.js')}"></script>
<script type="text/javascript" src="${resource(dir: 'js', file: 'highcharts/highcharts.js')}"></script>
<script type="text/javascript" src="${resource(dir: 'js', file: 'highcharts/modules/exporting.js')}"></script>
2、通过MainController中的方法计算mem
复制代码 代码示例:
package hf
import grails.converters.JSON
class MainController {
def calc = {
Runtime runtime = Runtime.getRuntime();
Process process = runtime.exec("tasklist /fo csv");
int i = 0;
def list = [];
process.inputStream.eachLine {String line ->
if (i >= 1) {
String[] p = line.split(/","/)
Mem mem = new Mem();
mem.name = p[0].trim().replaceAll(""","");
mem.pid = p[1].trim() as int;
mem.memSize = (p[4].replaceAll(""","").replaceAll(",","").replaceAll(" ","").replaceAll("K","")) as int;
println "name:"+mem.name+";pid:"+mem.pid+";memSize:"+mem.memSize;
def map = [:];
map.id=mem.id;
map.pid = mem.pid;
map.name = mem.name;
map.memSize = mem.memSize;
list.add(map);
}
i++;
}
return render(list as JSON);
}
}
3、在web页面中用$.post去取得数据
复制代码 代码示例:
$(document).ready(function() {
$.post("${createLink(controller:'main',action:'calc')}", {type:'init'}, function(data) {
//进程名
var memNames = new Array();
//进程使用的内存
var memValues = new Array();
jQuery.each(data, function(index,mem) {
memNames[index] = mem.name;
memValues[index] = mem.memSize/1024;
});
//alert(data);
//alert(memValues)
showData(memNames,memValues);
});
});
4、html中div的设置
复制代码 代码示例:
<div style="width:500px;height:500px;overflow:auto;">
<div id="container" style="width:6000px;height:400px;margin:0 auto;"></div>
</div>
5、用highCharts显示数据
复制代码 代码示例:
function showData(mNames,mValues) {
chart = new Highcharts.Chart({
chart: {
renderTo: 'container',
defaultSeriesType: 'line',
marginRight: 130,
marginBottom: 50
},
title: {
text: '
电脑性能',
x: -20 //center
},
subtitle: {
text: '我的电脑性能',
x: -20
},
//X轴
xAxis: {
title:{
text:'进程名'
},
categories: mNames
}, //
www.jb200.com
//y轴
yAxis: {
title: {
text: '内存使用(MB)'
},
//y=0
plotLines: [
{
value: 0,
width: 2,
color: '#000000'
}
]
},
tooltip: {
formatter: function() {
return '<b>' + this.series.name + '</b><br/>' +
this.x + ': ' + this.y + 'M';
}
},
//右边的提示
legend: {
layout: 'vertical',
align: 'right',
verticalAlign: 'top',
x: -10,
y: 100,
borderWidth: 0
},
series: [
{
name: '内存使用',
data: mValues
}
]
});
}
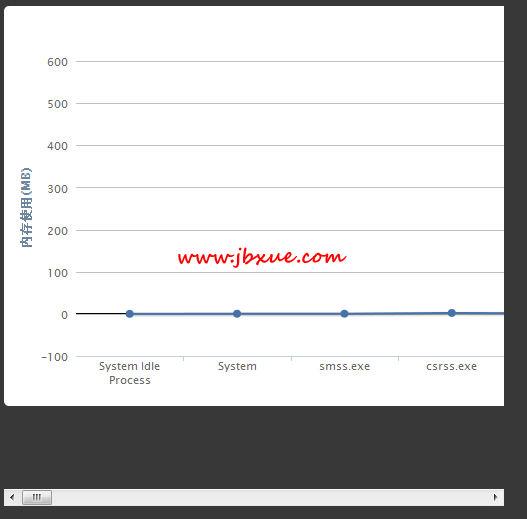
6,最终结果,如下图: