rrdtool 监控 网络流量配置一例,供大家学习参考。
首先,在被监控的机器上。
yum -y install net-snmp*
vi /etc/snmp/snmpd.conf
com2sec notConfigUser 10.10.10.210(这里写监控机的IP) cctvcj
group notConfigGroup v1 notConfigUser
group notConfigGroup v2c notConfigUser
view all included .1 80
access notConfigGroup "" any noauth exact all none none
接下来,在监控机器上。
#!/bin/bash
set -x
rrd=/usr/bin/rrdtool
snmpwalk=/usr/bin/snmpwalk
pwd=cctvcj
dir=/usr/local/nginx/html
mkdir -p $dir
for host in 192.168.0.233 192.168.0.4 192.168.0.43
do
if [ "$host" = "10.10.10.125" ]
then
hostn="moshou"
elif [ "$host" = "192.168.0.4" ]
then
hostn="bjfms1"
elif [ "$host" = "192.168.0.3" ]
then
hostn="bjfms2"
elif [ "$host" = "192.168.0.233" ]
then
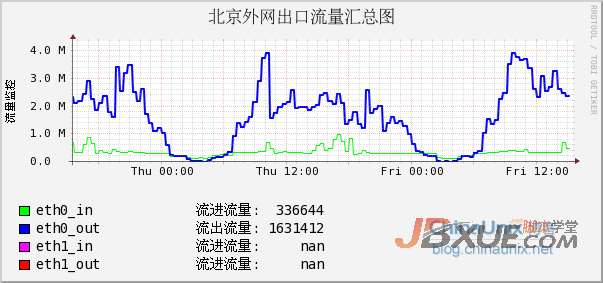
hostn="北京外网出口流量汇总图"
else
echo "no......................"
fi
$snmpwalk -v 2c -c $pwd $host IF-MIB::ifHCInOctets > ${dir}/${host}.in
$snmpwalk -v 2c -c $pwd $host IF-MIB::ifHCOutOctets > ${dir}/${host}.out
if [ "$host" = "192.168.0.233" ]
then
eth0_in=`snmpwalk -v 2c -c cctvcj 192.168.0.233 IF-MIB::ifHCInOctets.124|linuxjishu/13830.html target=_blank class=infotextkey>awk '{print $NF}'`
eth0_out=`snmpwalk -v 2c -c cctvcj 192.168.0.233 IF-MIB::ifHCOutOctets.124|awk '{print $NF}'`
else
eth0_in=`awk 'NR ==2{print $NF}' ${dir}/${host}.in `
eth0_out=`awk 'NR ==2{print $NF}' ${dir}/${host}.out`
eth1_in=`awk 'NR ==3{print $NF}' ${dir}/${host}.in`
eth1_out=`awk 'NR ==3{print $NF}' ${dir}/${host}.out `
fi
rm -f ${dir}/${host}.in
rm -f ${dir}/${host}.out
starttime=`date -d "1 days ago" +%s`
if [ -e "${dir}/${host}.rrd" ]
then
echo "${dir}/${host}.rrd is old" >> /dev/null 2>&1
else
$rrd create ${dir}/${host}.rrd --start $starttime
--step 60
DS:eth0_in:COUNTER:600:0:1250000000000
DS:eth0_out:COUNTER:600:0:1250000000000
DS:eth1_in:COUNTER:600:0:1250000000000
DS:eth1_out:COUNTER:600:0:1250000000000
RRA:AVERAGE:0.5:1:600
RRA:AVERAGE:0.5:4:600
RRA:AVERAGE:0.5:24:600
RRA:AVERAGE:0.5:288:600
fi
$rrd update ${dir}/${host}.rrd N:${eth0_in}:${eth0_out}:${eth1_in}:${eth1_out}
#--width=500
$rrd graph ${dir}/${host}.png
--start now-48h
--imgformat=PNG
--title="$hostn"
--base=1000
--height=120
-w 500
--alt-autoscale-max
--lower-limit=0
COMMENT:" n"
--vertical-label="流量监控"
--slope-mode
--font TITLE:12:
--font AXIS:8:
--font LEGEND:10:
--font UNIT:8:
DEF:a="${dir}/${host}.rrd":eth0_in:AVERAGE:step=60
LINE1:a#00FF00:"eth0_in"
GPRINT:a:AVERAGE:"t 流进流量:%8.0lf n"
DEF:b="${dir}/${host}.rrd":eth0_out:AVERAGE:step=60
LINE2:b#0000FF:"eth0_out"
GPRINT:b:AVERAGE:"t 流出流量:%8.0lf n"
DEF:c="${dir}/${host}.rrd":eth1_in:AVERAGE:step=60
LINE3:c#FF00FF:"eth1_in"
GPRINT:c:AVERAGE:"t 流进流量:%8.0lf n"
DEF:d="${dir}/${host}.rrd":eth1_out:AVERAGE:step=60
LINE4:d#FF0000:"eth1_out"
GPRINT:d:AVERAGE:"t 流进流量:%8.0lf n"
done
效果图如下所示: