<?
define("ANGLE_STEP", 5); //定义画椭圆弧时的角度步长
function draw_getdarkcolor($img,$clr) //求$clr对应的暗色
{
$rgb = imagecolorsforindex($img,$clr);
return array($rgb["red"]/2,$rgb["green"]/2,$rgb["blue"]/2);
}
function draw_getexy($a, $b, $d) //求角度$d对应的椭圆上的点坐标
{
$d = deg2rad($d);
return array(round($a*Cos($d)), round($b*Sin($d)));
}
function draw_arc($img,$ox,$oy,$a,$b,$sd,$ed,$clr) //椭圆弧函数
{
$n = ceil(($ed-$sd)/ANGLE_STEP);
$d = $sd;
list($x0,$y0) = draw_getexy($a,$b,$d);
for($i=0; $i<$n; $i++)
{
$d = ($d+ANGLE_STEP)>$ed?$ed:($d+ANGLE_STEP);
list($x, $y) = draw_getexy($a, $b, $d);
imageline($img, $x0+$ox, $y0+$oy, $x+$ox, $y+$oy, $clr);
$x0 = $x;
$y0 = $y;
}
}
function draw_sector($img, $ox, $oy, $a, $b, $sd, $ed, $clr) //画扇面
{
$n = ceil(($ed-$sd)/ANGLE_STEP);
$d = $sd;
list($x0,$y0) = draw_getexy($a, $b, $d);
imageline($img, $x0+$ox, $y0+$oy, $ox, $oy, $clr);
for($i=0; $i<$n; $i++)
{
$d = ($d+ANGLE_STEP)>$ed?$ed:($d+ANGLE_STEP);
list($x, $y) = draw_getexy($a, $b, $d);
imageline($img, $x0+$ox, $y0+$oy, $x+$ox, $y+$oy, $clr);
$x0 = $x;
$y0 = $y;
}
imageline($img, $x0+$ox, $y0+$oy, $ox, $oy, $clr);
list($x, $y) = draw_getexy($a/2, $b/2, ($d+$sd)/2);
imagefill($img, $x+$ox, $y+$oy, $clr);
}
function draw_sector3d($img, $ox, $oy, $a, $b, $v, $sd, $ed, $clr) //3d扇面
{
draw_sector($img, $ox, $oy, $a, $b, $sd, $ed, $clr);
if($sd<180)
{
list($R, $G, $B) = draw_getdarkcolor($img, $clr);
$clr=imagecolorallocate($img, $R, $G, $B);
if($ed>180) $ed = 180;
list($sx, $sy) = draw_getexy($a,$b,$sd);
$sx += $ox;
$sy += $oy;
list($ex, $ey) = draw_getexy($a, $b, $ed);
$ex += $ox;
$ey += $oy;
imageline($img, $sx, $sy, $sx, $sy+$v, $clr);
imageline($img, $ex, $ey, $ex, $ey+$v, $clr);
draw_arc($img, $ox, $oy+$v, $a, $b, $sd, $ed, $clr);
list($sx, $sy) = draw_getexy($a, $b, ($sd+$ed)/2);
$sy += $oy+$v/2;
$sx += $ox;
imagefill($img, $sx, $sy, $clr);
}
}
function draw_getindexcolor($img, $clr) //RBG转索引色
{
$R = ($clr>>16) & 0xff;
$G = ($clr>>8)& 0xff;
$B = ($clr) & 0xff;
return imagecolorallocate($img, $R, $G, $B);
}
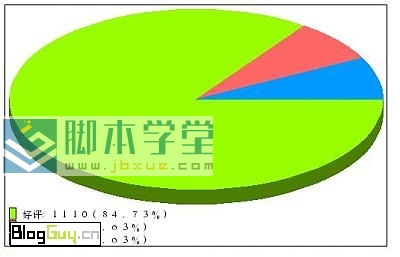
// 绘图主函数,并输出图片
// $datLst 为数据数组, $datLst 为标签数组, $datLst 为颜色数组
// 以上三个数组的维数应该相等
function draw_img($datLst,$labLst,$clrLst,$a=250,$b=120,$v=20,$font=10)
{
$ox = 5+$a;
$oy = 5+$b;
$fw = imagefontwidth($font);
$fh = imagefontheight($font);
$n = count($datLst);//数据项个数
$w = 10+$a*2;
$h = 10+$b*2+$v+($fh+2)*$n;
$img = imagecreate($w, $h);
//转RGB为索引色
for($i=0; $i<$n; $i++)
$clrLst[$i] = draw_getindexcolor($img,$clrLst[$i]);
$clrbk = imagecolorallocate($img, 0xff, 0xff, 0xff);
$clrt = imagecolorallocate($img, 0x00, 0x00, 0x00);
//填充背景色
imagefill($img, 0, 0, $clrbk);
//求和
$tot = 0;
for($i=0; $i<$n; $i++)
$tot += $datLst[$i];
$sd = 0;
$ed = 0;
$ly = 10+$b*2+$v;
for($i=0; $i<$n; $i++)
{
$sd = $ed;
$ed += $datLst[$i]/$tot*360;
//画圆饼
draw_sector3d($img, $ox, $oy, $a, $b, $v, $sd, $ed, $clrLst[$i]); //$sd,$ed,$clrLst[$i]);
//画标签
imagefilledrectangle($img, 5, $ly, 5+$fw, $ly+$fh, $clrLst[$i]);
imagerectangle($img, 5, $ly, 5+$fw, $ly+$fh, $clrt);
//imagestring($img, $font, 5+2*$fw, $ly, $labLst[$i].":".$datLst[$i]."(".(round(10000*($datLst[$i]/$tot))/100)."%)", $clrt);
$str =
iconv("GB2312", "UTF-8", $labLst[$i]);
ImageTTFText($img, $font, 0, 5+2*$fw, $ly+13, $clrt, "./simsun.ttf", $str.":".$datLst[$i]."(".(round(10000*($datLst[$i]/$tot))/100)."%)");
$ly += $fh+2;
}
//输出图形
header("Content-type: image/png");
//输出生成的图片
$imgFileName = "temp/".time().".png";
imagepng($img,$imgFileName);
echo '<IMG SRC="'.$imgFileName.'" BORDER="1">';
}
?>