node.js”κmongodb Βœ÷ΦρΒΞ»’÷ΨΖ÷ΈωœΒΆ≥ΒΡ“ΜΕΈ¥ζ¬κΘ§«ΑΕΥ”ΟjsΘ§ΖΰΈώΤς”ΟjsΘ§ΨΆΝ§ ΐΨίΩβΒΡshellΕΦ «jsΘ§ΉνΙΊΦϋ «¥ζ¬κΝΩ–ΓΘ§–η“ΣΒΡ≈σ”―≤ΈΩΦœ¬ΓΘ
ΈΣΝΥ±ψ”ΎΖ÷ΈωΑ―œνΡΩΒΡ»’÷ΨΕΦ¥φ≥…ΝΥjsonΗώ ΫΓΘ÷°«Α»’÷Ψ÷±Ϋ”¥φ‘ΎΝΥΈΡΦΰ÷–Θ§Εχmongodb ±¥≥»κΝΥΈ“ΒΡ ”œΏΘ§”Ύ «ΨΆΑ―log¥φΫχΝΥmongodb÷–ΓΘ
log÷Μ¥φΤπά¥ «ΟΜ”–“β“εΒΡΘ§ΉνΙΊΦϋΒΡ «“Σ¥”»’÷Ψ÷–ΖΔœ÷“ΒΈώΒΡ«ς ΤΓΔœΒΆ≥ΒΡ–‘Ρή¬©Ε¥Β»ΓΘ
÷°«Α”–“ΜΗω”Οjava–¥ΒΡΖ÷ΈωΡΘΩιΘ§‘Υ––‘Ύtomcatœ¬ΓΘ
Βœ÷œύΒ±ΒΡ÷ΊΝΩΦΕΘ§ΧμΦ”“ΜΗω–¬÷Η±ξΒΡΝς≥Χ“≤±»ΫœΖ±ΥωΘ§Εχ«“”…”ΎnfsΒΡ‘≠“ρΜΙΒΦ÷¬Ζ÷Έω ßΑήΓΘ
«ΑΕΥ”ΟjsΘ§ΖΰΈώΤς”ΟjsΘ§ΨΆΝ§ ΐΨίΩβΒΡshellΕΦ «jsΘ§ΉνΙΊΦϋ «¥ζ¬κΝΩ–ΓΓΘ
“ΜΓΔ”Οnode.js Βœ÷ΖΰΈώΤςΕΥ¥ζ¬κ
ΈΣΝΥ”–ΝΦΚΟΒΡΖγΗώΚΆΩλΥΌΒΡ¥ζ¬κ±ύ–¥Θ§≤ΜΩ…±ήΟβΒΊ”ΠΗΟ≤…”Ο“ΜΗωΦρΒΞΒΡΩρΦήΓΘExpress Βœ÷ΝΥ¥σ≤ΩΖ÷ΒΡΙΠΡήΘ§Ω… «ΚΟ–η“ΣΜ®“ΜΕ® ±Φδ λœΛΘ§≤Δ«“Ω¥Τπά¥Ε‘’βΗωœνΡΩά¥ΥΒ”––©÷ΊΝΩΦΕΓΘ‘ΎNode.jsΒΡΙΌΆχ…œ”–“ΜΗωΝΡΧλΒΡDemoΘ§’βΗω¥ζ¬κΦρΒΞ“ΤΕ·Θ§ΖβΉΑΝΥΕ‘URLΒΡ¥ΠάμΚΆΖΒΜΊJSONΓΘ”Ύ «Έ“ΨΆ÷±Ϋ” Ι”ΟΝΥfu.jsΘ§÷Ί–¥ΝΥserver.jsΘΚ
Η¥÷Τ¥ζ¬κ ¥ζ¬κ Ψάΐ:
HOST = null; // localhost
PORT = 8001;
var fu =
require("./fu"),
sys = require("util"),
url = require("url"),
mongo = require("./request_handler");
fu.listen(Number(process.env.PORT || PORT), HOST);
fu.get("/", fu.staticHandler("index.html"));
“ΜΗωΖΰΈώΤς“―Ψ≠Ϋ®ΝΔΤπά¥ΝΥΓΘ
¥Πάμ«κ«σΒΡrequest_handler.js¥ζ¬κΘΚ
Η¥÷Τ¥ζ¬κ ¥ζ¬κ Ψάΐ:
var mongodb = require("mongodb");
var fu = require("./fu");
// TOP 10 user Action
fu.get("/userActionTop10", function(req, res){
mongodb.connect(‘mongodb://localhost:27017/log‘, function(err, conn){
conn.collection(‘action_count‘, function(err, coll){
coll.find({"value.action":{$in:user_action}}).sort({"value.count":-1}).limit(10).toArray(function(err, docs){
if(!err){
var action = [];
var count = [];
for(var i = 0; i < docs.length; i ++){
//console.log(docs[i]);
action.push(docs[i].value.action);
count.push(docs[i].value.count);
}
res.simpleJSON(200, {action:action, count:count});
// “ΜΕ®“ΣΦ«ΒΟΙΊ±’ ΐΨίΩβΝ§Ϋ”
conn.close();
}
});
});
});
});
Ά§―υΚήΦρΒΞΓΘ
ΕΰΓΔΩΆΜßΕΥ
»’÷ΨœΒΆ≥ΒΡΉν÷Ί“ΣΒΡ «Ω… ”Μ·œ‘ ΨΘ§’βάο Ι”ΟΝΥjqueryΒΡ“ΜΗω≤εΦΰjqPlot ChartΓΘ Ήœ» Ι”Ο“ΜΗωΨ≤Χ§ΒΡHTML“≥ΟφΘ§”Οά¥ΉςΈΣΆΦ–Έœ‘ ΨΒΡ»ίΤςΘΚ
Η¥÷Τ¥ζ¬κ ¥ζ¬κ Ψάΐ:
<!DOCTYPE html>
<html>
<head>
<meta charset="utf-8">
<title>Rendezvous Monitor System</title>
<!–[if lt IE 9]><script src="js/excanvas.js"><![endif]–>
<script src="js/jquery.min.js"></script>
<script src="js/jquery.jqplot.min.js"></script>
<script src="js/plugins/jqplot.barRenderer.min.js"></script>
<script src="js/plugins/jqplot.categoryAxisRenderer.min.js"></script>
<script src="js/plugins/jqplot.canvasTextRenderer.min.js"></script>
<script src="js/plugins/jqplot.canvasAxisTickRenderer.min.js"></script>
<script src="js/plugins/jqplot.canvasAxisLabelRenderer.min.js"></script>
<script src="js/plugins/jqplot.pointLabels.min.js"></script>
<script src="js/plugins/jqplot.dateAxisRenderer.min.js"></script>
<script src="js/plugins/jqplot.json2.min.js"></script>
<link rel="stylesheet" href="js/jquery.jqplot.min.css">
<link rel="stylesheet" href="style/base.css">
<script src="js/charts.js"></script>
</head>
<body>
</body>
</html>
ΦΗΚθ «jqPlotΒΡ Ψάΐ÷–ΒΡΆξ’ϊΩΫ±¥ΓΘ
œ‘ Ψ…ζ≥…ΆΦ–ΈΒΡchart.jsΘΚ
Η¥÷Τ¥ζ¬κ ¥ζ¬κ Ψάΐ:
// Store all chart drawing function, if we want to disable one chart, only need
// comment the push line when putting fucntion into the array.
var draws = [];
/****************************** TOP 10 User Action Start *********************************/
document.write(‘<div id="userActionTop10Chart"></div>‘);
var drawUserActionTop10Chart = function(){
if(!$("#userActionTop10Chart").attr(‘class‘)){
$("#userActionTop10Chart").attr(‘class‘, ‘small_chart‘);
}
$.ajax({
async:false,
url: ‘/userActionTop10‘,
dataType:‘json‘,
cache: false,
success:function(data){
try{
$(‘#userActionTop10Chart‘).html(”);
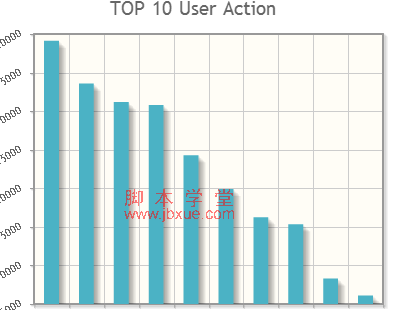
$.jqplot(‘userActionTop10Chart‘, [data.count], {
title: "TOP 10 User Action",
seriesDefaults:{
renderer:$.jqplot.BarRenderer,
rendererOptions: {fillToZero: true},
pointLabels: {
show:true,
ypadding:1
}
},
axesDefaults:{
tickRenderer:$.jqplot.CanvasAxisTickRenderer,
tickOptions: {
angle: -30,
fontSize: ‘12px‘
}
},
axes: {
xaxis: {
renderer: $.jqplot.CategoryAxisRenderer,
ticks: data.action
},
yaxis: {
pad: 1.05
}
}
});
}catch(e){
//alert(e.message);
}
}
});
}
draws.push(‘drawUserActionTop10Chart‘);
/******************************* TOP 10 User Action End ************************************/
/*********** Chart Start *****************/
//Put your chart drawing function here
//1. insert a div for the chart
//2. implement the function drawing chart
//3. push the function name into the array draws
/*********** Chart End *******************/
// Draw all charts
var drawAllCharts = function(){
for(var i = 0; i < draws.length; i ++){
eval(draws[i] + "()");
}
//Recall itself in 5 minute.
window.setTimeout(drawAllCharts, 5 * 60 * 1000);
}
//
$(function(){
drawAllCharts();
});
ΖΰΈώΤςΕΥΚΆΩΆΜßΕΥΒΡ¥ζ¬κΕΦ”–ΝΥΘ§Ρ«ΨΆ≈ήΤπά¥Ω¥–ßΙϊΑ…ΘΚ
»’÷ΨΒΡΖ÷Έω¥ζ¬κΓΘ
»ΐΓΔ Ι”ΟMongoDB ‘ωΝΩ ΫMapReduce Βœ÷»’÷ΨΖ÷Έω
‘ΎMongoDBΒΡΈΡΒΒ÷–”–ΙΊ”ΎIncremental MapReduceΒΡΫι…ήΓΘΗ’ΩΣ Φ“Μ÷±“‘ΈΣMongoDB Βœ÷Streaming¥ΠάμΘ§Ω…“‘Ή‘Ε·÷¥––‘ωΝΩ ΫΒΡMapReduceΓΘΉνΚσΖΔœ÷‘≠ά¥ «Έ“άμΫβ”–ΈσΘ§ΈΡΒΒάο≤ΔΟΜ”––¥’β“ΜΒψΘ§÷Μ «ΥΒΟςΝΥ»γΚΈ…η÷Ο≤≈Ρή‘ωΝΩ÷¥––MapReduceΓΘ
Α―MapReduce Ι”ΟMongoDBΒΡjavascript–¥‘ΎΝΥΒΞΕάΒΡjsΈΡΦΰ÷–Θ§»ΜΚσΆ®ΙΐcrontabΕ® ±÷¥––ΓΘ
stats.js¥ζ¬κΘΚ
Η¥÷Τ¥ζ¬κ ¥ζ¬κ Ψάΐ:
/************** The file is executed per 5 minutes by /etc/crontab.*****************/
var action_count_map = function(){
emit(this.action, {action:this.action, count:1});
}
var action_count_reduce = function(key, values){
var count = 0;
values.forEach(function(value){
count += value.count;
});
return {action:key, count : count};
}
db.log.mapReduce(action_count_map, action_count_reduce, {query : {‘action_count‘ : {$ne:1}},out: {reduce:‘action_count‘}});
db.log.update({‘action_count‘:{$ne:1}}, {$set:{‘action_count‘:1}}, false, true);
ΥΦ¬ΖΘΚ
1ΓΔ‘Ύmap÷–ΫΪΟΩΗωactionΖΟΈ ¥Έ ΐ…ηΈΣ1
2ΓΔreduce÷–Θ§Ά≥ΦΤœύΆ§actionΒΡΖΟΈ ¥Έ ΐ
3ΓΔ÷¥––mapReduceΓΘ÷ΗΕ®ΝΥ≤ι―·ΈΣ‘action_count’≤ΜΒ»”Ύ1Θ§“≤ΨΆ «ΟΜ”–÷¥––ΙΐΗΟΆ≥ΦΤΘΜΫΪΫαΙϊ¥φ¥Δ‘Ύ‘action_count’Φ·ΚœΘ§≤Δ«“ Ι”Οreduce―Γœν±μ ΨΗΟΫαΙϊΦ·ΉςΈΣœ¬¥ΈreduceΒΡ δ»κΓΘ
4ΓΔ‘ΎΒ±«ΑΥυ”–»’÷ΨΦ«¬Φ…η÷Ο’action_count’ΒΡ÷ΒΈΣ1Θ§±μ Ψ“―Ψ≠÷¥––ΙΐΗΟΆ≥ΦΤΓΘ≤Μ÷ΣΒά’β÷÷ «ΖώΜα‘λ≥…ΟΜ”–ΜΙΟΜ”–Ά≥ΦΤΙΐΒΡΦ«¬Φ“≤±ΜΗϋ–¬ΘΩΆϊ”–Ψ≠―ιΒΡ¥σœά¥ΆΫΧΘΓ
Ε® ±÷¥––stats.jsΒΡshellΘΚ
*/5 * * * * root cd /root/log; mongo localhost:27017/log stats.js