wxpython 有一个简单的图表绘制库. 具有缩放、图例以及网格特性.
专题:wxpython中文教程
可用的报表 (graph) 有:
分布scatter
曲线line
柱状图bar
[more…]我们必须安装 Numeric 库(python-numm). 其它一些图标绘制库有 Gnuplot (python-gnuplot) 或者 MatPlotLib (python-matplotlib) 等,都必须独立安装才能用.
要创建出一个图表,有以下几步:
1. 定义数据
将数据插入到一个元组清单中去. 每个元组有两个项目.
data = [(x1, y1), (x2, y2), (x3, y3),
(x4, y4), (x5, y5), (x6, y6)]
2. 创建处一个绘制画布
要创建出一个 PlotCanvas 对象,作为框架(frame)的子对象.
3. 创建处图形
这里有两个类:PolyLine 以及 PolyMarker. PolyLine 类定义曲线图形. 它的构建器是:
PolyLine(list data, wx.Colour colour, integer width,
integer style, string legend)
参数“data”就是要显示的数据. “colour”定义线条的颜色. “width”用于绘制图形的笔触大小. “style”参数可能是wx.Pen样式. “legend”是线条的图例.
PolyMarker 可用于创建分布图表和柱状图,它的构建器为:
PolyMarker(list data, wx.Colour colour, integer size,
wx.Colour fillcolour, integer fillstyle,
string markershape, string legend)
“fillstyle”也是用于指定 wx.Pen 样式.
标记(marker)形状有:
circle
dot
square
triangle
triangle_down
cross
plus
4. 创建一个图形容器
图形容器是一个用来装入一个图形对象及其标题与标签的容器.
PlotGraphics(list objects, string title, string xLabel,
string yLabel)
“objects”是由一个或多个图形对象组成的清单
“title”位于图形顶部的标题
“xLabel” – 显示在x轴上的标签
“yLabel” – 显示在y轴上的标签
5. 绘制该图形
绘出该图形.
“gc”是一个图形容器对象. “xAxis”及“yAxis”定义了坐标轴的范围.
#!/usr/bin/python
#coding=utf-8
#plot.py
import wx
import wx.lib.plot as plot
class Plot(wx.Dialog):
def __init__(self, parent, id, title):
wx.Dialog.__init__(self, parent, id, title, size=(180, 280))
self.data = [(1, 2), (2, 3), (3, 5), (4, 6), (5, 8), (6, 8),
(10, 10)]
btn1 = wx.Button(self, 1, "分 布", (50, 50))
btn1 = wx.Button(self, 2, "曲 线", (50, 90))
btn1 = wx.Button(self, 3, "柱状图", (50, 130))
btn1 = wx.Button(self, 4, "退 出", (50, 170))
wx.EVT_BUTTON(self, 1, self.OnScatter)
wx.EVT_BUTTON(self, 2, self.OnLine)
wx.EVT_BUTTON(self, 3, self.OnBar)
wx.EVT_BUTTON(self, 4, self.OnQuit)
wx.EVT_CLOSE(self, self.OnQuit)
def OnScatter(self, event):
frm = wx.Frame(self, -1, '分 布', size=(600, 450))
client = plot.PlotCanvas(frm)
markers = plot.PolyMarker(self.data, marker='triangle_down',
colour='pink')
gc = plot.PlotGraphics([markers], '分布图', 'X 轴', 'Y 轴')
client.Draw(gc, (0, 15), (0, 15))
frm.Show(True)
def OnLine(self, event):
frm = wx.Frame(self, -1, '曲 线', size=(600, 450))
client = plot.PlotCanvas(frm)
line = plot.PolyLine(self.data, colour='pink', width=5,
legend='数值')
gc = plot.PlotGraphics([line], '曲线图', 'X 轴', 'Y 轴')
client.Draw(gc, (0, 15), (0, 15))
frm.Show(True)
def OnBar(self, event):
frm = wx.Frame(self, -1, '柱状图', size=(600, 450))
client = plot.PlotCanvas(frm)
bar1 = plot.PolyLine([(1, 0), (1, 5)], legend='', colour='gray',
width=25)
bar2 = plot.PolyLine([(3, 0), (3, 8)], legend='', colour='gray',
width=25)
bar3 = plot.PolyLine([(5, 0), (5, 12)], legend='', colour='gray',
width=25)
bar4 = plot.PolyLine([(6, 0), (6, 2)], legend='', colour='gray',
width=25)
gc = plot.PlotGraphics([bar1, bar2, bar3, bar4], '柱状图', 'X 轴',
'Y 轴')
client.Draw(gc, (0, 15), (0, 15))
frm.Show(True)
def OnQuit(self, event):
self.Destroy()
class MyApp(wx.App):
def OnInit(self):
dlg = Plot(None, -1, 'plot.py')
dlg.Show(True)
dlg.Center()
return True
app = MyApp(0)
app.MainLoop()
如图:
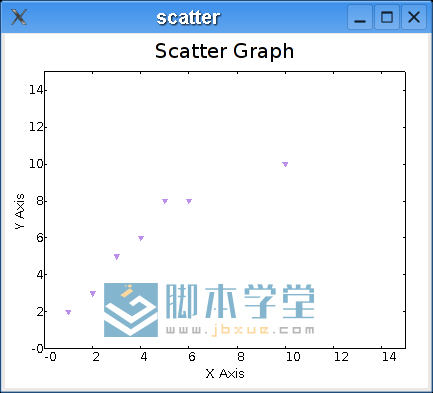
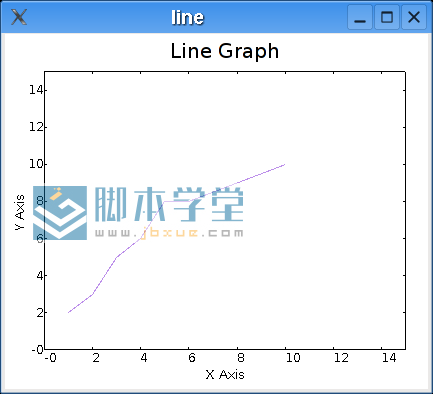
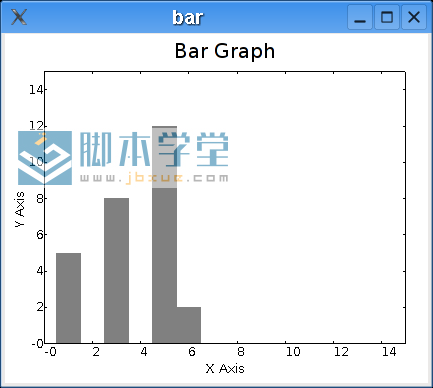
图:分布、曲线和柱状图scatter, line, bar graphs